The last look at American poverty?
Hello, and welcome back to This Kairos Moment — a publication that keeps up with powerful organizing around the country, aimed at answering the questions “what works?” and “what can we do?” amidst this economic and political crisis.
This week, we're unpacking the latest U.S. poverty numbers to better understand the crisis of poverty. Data like this can be a lot to digest. To keep this readable, I'll use expandable cards for extra information that is helpful, but not necessary for your understanding. Like this:
Where's this data from?
Unless otherwise indicated, the data here was pulled for the Kairos Center by the Center on Poverty and Social Policy at Columbia University using the 2025 Annual Social and Economic Supplement to the Current Population Survey (representative of the 2024 calendar year). Data was retrieved from the US Census Bureau. Rounding may cause totals to differ slightly from the sum of their individual components.
Poverty data is released once a year by the Census Bureau and gives us a snapshot of how Americans were faring the year before. Meaning, what you're about to read is for the year 2024, prior to the second Trump administration and the passage of the latest budget from Congress. This is important to remember because the current administration is set on taking away millions of Americans' housing, health care, and food assistance, which will push many more people below the poverty line. With that in mind, let's get into it.
How do we measure poverty?
There are many different ways to measure poverty, but the two measures we’ll focus on are the Official Poverty Measure (OPM) and the Supplemental Poverty Measure (SPM). Both of these are used by the US Census and different government agencies.
The OPM was developed in 1963 and is based on income and food expense data from 1955. At that time, a poor family of 3 or more was found to spend about 1/3 of their income on food. While the OPM has been updated to account for inflation based on the Consumer Price Index, it does not account for how household composition and expenses have changed over the past 60 years. The OPM still assumes the basic formula – that households spend 1/3 of their income on food – but it does not reflect current patterns of household spending, including how rent, child care, health care, gas, or other common household expenses have changed since 1955.
In 1995, the National Academy of Sciences recommended a new measure for estimating poverty in the United States.[1] The result has been the development and US Census Bureau publication (since 2011) of the SPM. The SPM accounts for family income after taxes and transfers, and as such, it shows the antipoverty effects of some of the largest federal support programs, including the Supplemental Nutrition Assistance Program (food stamps/SNAP) and the Earned Income Tax Credit (EITC). It also takes into account critical out-of-pocket expenses for food, clothing, housing, and utilities, and is adjusted by geography as well as housing tenure (whether you are a homeowner, mortgage-holder, or renter).[2]
As a comparison of the two measures:
- In 2024, the poverty threshold under the OPM was $31,812 for a 4-person household.
- Under the SPM, the poverty threshold for a 2-adult, 2-child household ranged from $32,586 to $39,430 depending on your geography, whether you were a renter or homeowner and whether or not you had a mortgage.
Poverty indicators are always estimates of some underlying conditions of income hardship that are difficult to observe. This means that these measurements are, to some degree, always limited. However, the SPM is the measure of choice by poverty researchers.[3] In 2019, the National Academies consensus report on reducing child poverty by half specified the SPM as the metric for evaluating potential policies.[4]
Although a broader and preferred measure, the SPM poverty threshold still remains an incomplete estimate of poverty. For instance, according to the SPM, a four-person household with an income of $40,000 is not poor because they fall above the designated poverty threshold. This means that many households living just above the poverty threshold aren’t counted as poor, even though they will have an incredibly hard time meeting their basic needs.
Instead, the population living between 100-199% of the poverty threshold is sometimes defined as “low-income.”[5] They are both living just one emergency, traffic violation or health care crisis away from being poor and most likely will fall under that poverty threshold – and into poverty – over the course of the year. This is why the 2019 National Academies’ consensus report also makes reference to families with incomes below 200 percent of the SPM poverty threshold as a group to look at closely when considering economic insecurity.
Taking these considerations into account, most of what you’ll read below includes both poor and low-income households, whose incomes under twice (or 200%) of the SPM threshold. We think this gives a more accurate picture of who is poor now and who will be poor in the near future, especially as the budget that was enacted in July goes into effect.
Who is poor?
According to the latest data, 41.4% of Americans are poor or low income. That's roughly 140 million people. This means that 2 in 5 Americans are unable to make ends meet or are one emergency away from poverty.
As you can see in the table below, poverty does not affect all Americans equally.
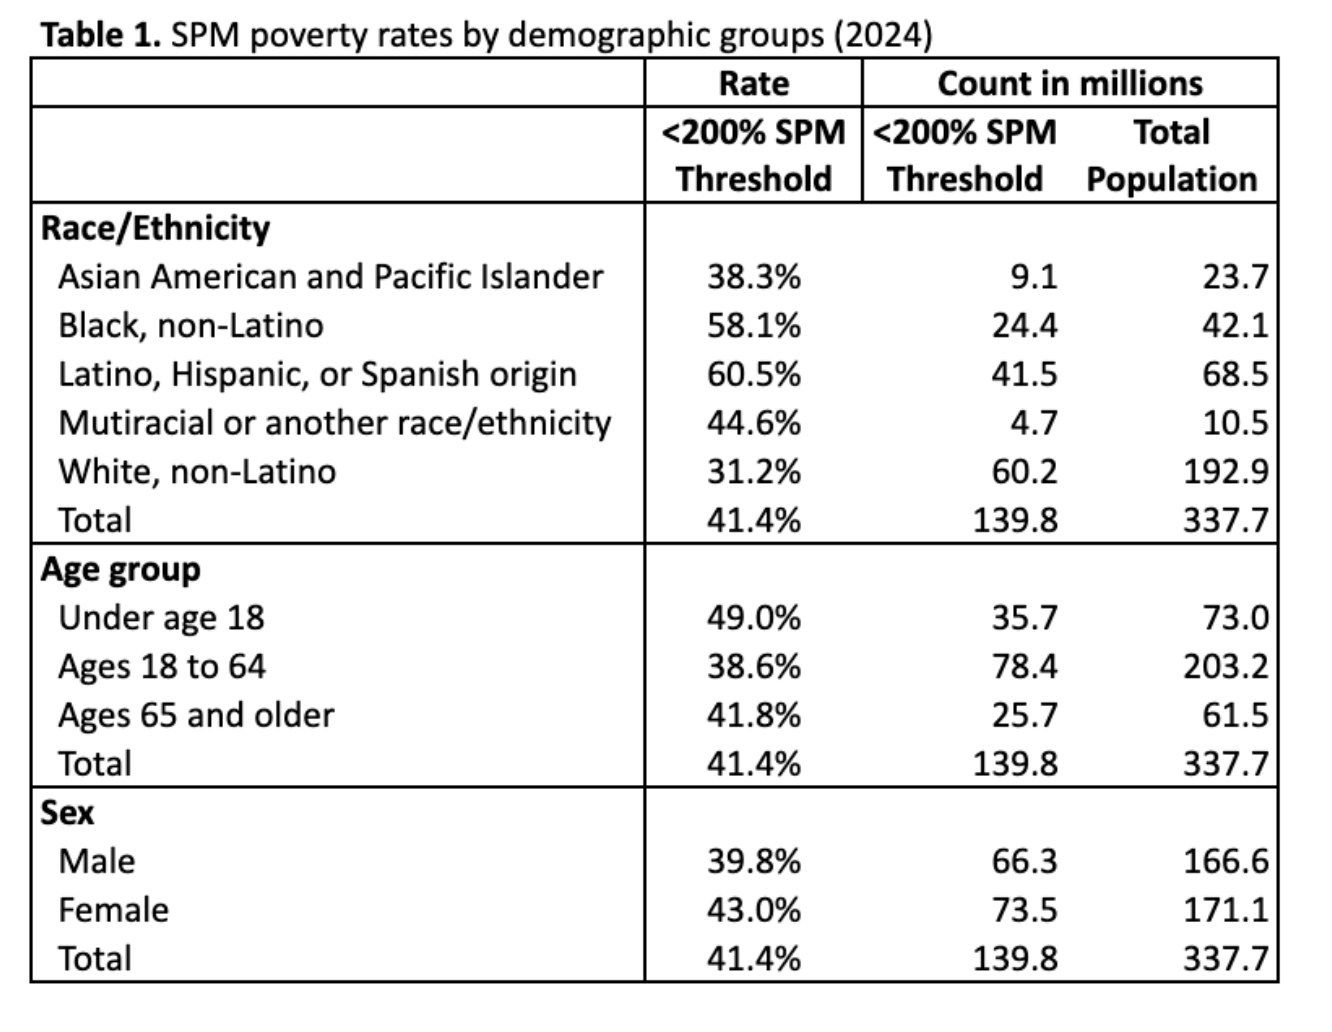
Demographic Inequality
While poverty and economic insecurity are widespread, they are also very uneven by demographic group. Most Black and Latino Americans fall beneath this expanded poverty line. Each group is 1.5 times more likely to be poor or low income than the average American, and twice as likely to be poor as white Americans. At the same time, there are more poor white people than poor people of any other racial/ethnic group.
Age and sex disparities are also apparent from this data. Children under the age of 18 are the poorest of the age cohorts, with nearly 1 in every 2 minors falling beneath this expanded poverty line. This is significant when compared to working age (18-64 years) and retirement age (65+ years), whose poverty rates are 7 and 10 percentage points lower. However, similar to the racial breakdown, it is important to note that the majority of poor or low income people in the United States are between 18 and 64 years old.
Male and female Americans also experience poverty at different rates, with 3% (or 7.2 million) more female Americans falling below the expanded poverty line than male Americans.
Geographic Inequality
As indicated in the maps below, poverty is unequally spread out across the country. The highest state-level poverty rates are in the coastal states, mostly in the Southeast and on the West Coast. Mississippi and California tie for the highest poverty rates each with 50% of its residents classifying as poor or low income. They are followed by Louisiana (48%), Florida (47%), and Nevada (46%).
The lowest poverty rates tend to fall in the heartland states. Although North Dakota has the lowest poverty rate, still 28% of its population is poor or low income. It is preceded by South Dakota (29%), New Hampshire (31%), Wisconsin (31%), and Nebraska (32%).
Percent Poverty + Low Income by State

OBBBA and the road ahead
CPSP has found that more and more Americans find themselves above the poverty line because of effective government programs. This corresponds with decades of stagnant wages and increasing living costs, which require additional support in the form of food stamps, housing subsidies and health care. Despite this reality, the "One Big Beautiful Bill Act" passed by Congress and signed by President Trump is set to strip millions of people from these critical programs.
Resource: Check out state fact sheets from CPSP to learn how many people are kept out of poverty because of programs like SNAP and housing subsidies and, and how many people stand to lose those benefits because of the OBBBA.
Part of the justification for these cuts is that they will push people into working more. However, not only is the jobs market considerably weaker than previously reported, many of the people participating in these programs are in fact working. They just aren’t earning enough to make ends meet, especially as inflation cancels out wage increases. In response to these conditions, households are taking on more and more debt: according to the New York Federal Reserve, household debt is over $18 trillion, nearly 1.5 times greater than it was in the months leading up to the 2008 financial crash.
This alarming economic picture does not fully account for the effects of workplace raids, domestic military deployment and the increasing use of state force, all of which is being targeted towards racialized, poor and low-income people first and worst.
Nor does it account for the other end of the spectrum and the accumulation of wealth, mainly by people who were already really wealthy. The OBBBA’s tax provisions, for example, will benefit an average poor household by less than $1 a day, while millionaires will receive, at a minimum, over $100,000 in tax breaks. Overall, the tax bill will cost $4.5 trillion, most of this heavily skewed in favor of wealthy individuals and corporations.
Transparency
It is clear that tens of millions of people who were already struggling will see even more difficult times soon. The human toll will be immense, and if recent actions by the Trump administration are any sign, we are going to have a harder time measuring that toll.
Indeed, the Trump Administration is getting more proactive in attempts to halt unflattering data. Last month, Trump fired the head of the Bureau of Labor Statistisc, Erika McEntarfer, in the wake of a jobs report reflecting the bleak market. In recent days, and just ahead of major cuts to SNAP, the administration announced it would cancel the annual food security survey administered by the Department of Agriculture and dismiss researchers. Without these public data initiatives, it will become much harder to assess how Americans are faring.
This pattern of stifling data, which reflects the suffering of Americans, is dangerous. For now, there has been no mention of the poverty numbers being canceled or suspended. We will have to wait and see when the next set, showing Trump's first year in office, is published.
What do we do?
Our ability to track and report on poverty data does not erase the stark reality that a growing number of people will be facing in the months ahead. Legendary labor organizer General Baker presciently defined this era of mass misery as a matter of survival: “the whole struggle for equality is now… a struggle for survival. Survival, plain and simple, cause we got no way to live… This whole question of jobs and…who’s got a right to live and who doesn’t, who can eat and who can have a home and who can’t....these are the real moral questions that we gotta deal with.”
These also call to question how we are organized to address these conditions and, eventually, move our country in a different direction, one where we can all live with dignity, freedom and peace. Given the racial and ethnic disparities among the population of poor and low-income households, it is critical to cross these lines of division. In these times of crisis, it’s more important to acknowledge that, regardless of race, age, gender or geography, most of us are three bad months away from losing our homes and none of us are three good months away to being billionaires.
As welfare rights and poverty organizers have been saying for years, it’s time to fight poverty, not the poor.
NOTE: The data in these graphics and tables reflects the categories used by the US Census Bureau, which simplify the racial, ethnic, and gender diversity of many Americans. The Kairos Center is working with poverty researchers and experts to complement the information above with more comprehensive poverty data as best as possible.